Smart Management. Higher Outcomes
Sprint Insight Dashboard | Live KPI Cockpit for Agile Leaders
All the answers to “How’s the sprint going?” on a single, built-in screen.
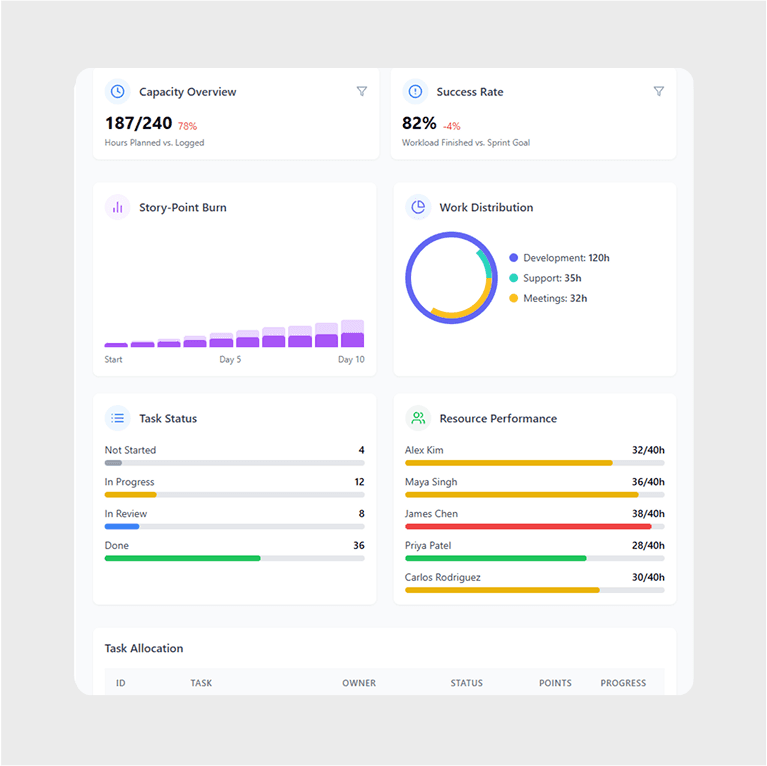
Select a sprint, and the dashboard lights up with four plug-and-play KPIs—Completion Rate, Active Work Items, Capacity Overview, Success Rate—plus story-point burn, task distribution, and per-resource capacity use. Every widget updates in real time as tasks move, so leaders can steer before scope slips.


How Sprint Insight Helps
Digging through boards to gauge progress:
One screen shows % complete, tasks in play, capacity used, and success rate.
No sense of where effort is going:
Work-distribution pie breaks hours into Meeting, Support, Development (custom labels welcome).
Blind to individual overload:
Resource Performance bar shows hours used vs. capacity per teammate—rebalance in one click.

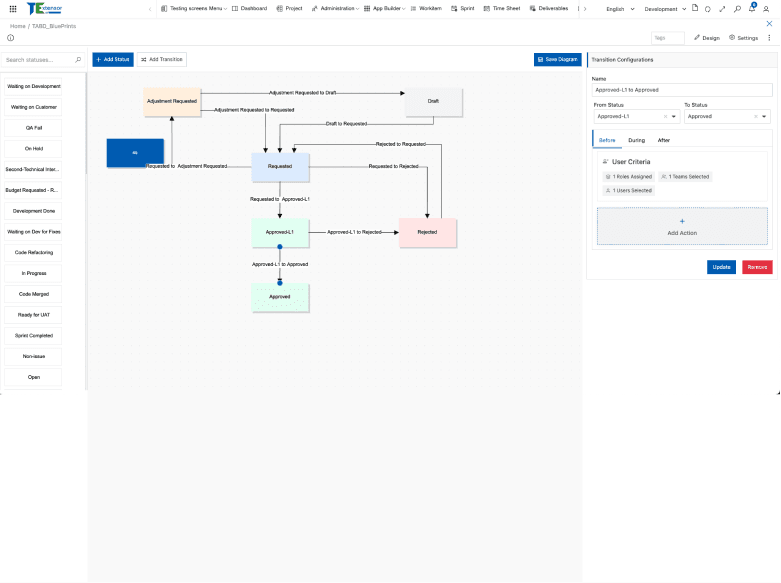
How It Works
Pick a Sprint
Dropdown lists current & past sprints—select one to refresh the board.
Review Core KPIs
Completion Rate – items Done ÷ total.
Active Work Items – count & % In Progress.
Capacity Overview – hours planned vs. logged.
Success Rate – workload finished vs. sprint goal.
Drill Into Context
Click any KPI tile → auto-filtered task list opens.
Scan Tactical Panels
Story-Point Burn – total vs. consumed.
Work Distribution – Dev, Support, Meeting hours.
Task Status Bars – Not Started / In Progress / In Review / Done.
Resource Performance – capacity used & remaining per person.
Task Allocation Table – who owns what, progress bar included.
Leadership Wins
Instant Risk Radar
Blockers and capacity overview in one dashboard so you can avoid any derailment.
Workload Clarity
See whether sprint effort skews to Support or Feature Dev and adjust priorities.
Data-Driven Stand-Ups
Open the dashboard, skip the round-robin guessing.
Transparent Stakeholder Updates
Numbers export in seconds; no midnight spreadsheet stitching.
