Smart Management. Higher Outcomes
Sprint Insight Dashboard
See completion, workload, velocity and risk change the instant work moves—no exports, no guess-work.


All Your Vital Signs, One Glance
A single metric bar keeps every stakeholder aligned—whether they care about scope, speed, or risk.
Completion, Capacity & Success-Rate tiles auto-refresh whenever a card moves.
Clickable tiles open a quick pop-up with the latest data, so you can spot trends without leaving the dashboard.
Overview of your KPIs at one place

Workload & Status Distribution
Know exactly where work sits and which types of tasks dominate—before bottlenecks bite.
Status counters show Not Started, In Progress, In Review and Done in real time.
Donut chart splits work by Dev, Support, Issue (or your own custom labels).
Sprint-Estimate table highlights effort by resource × project so you can rebalance early.
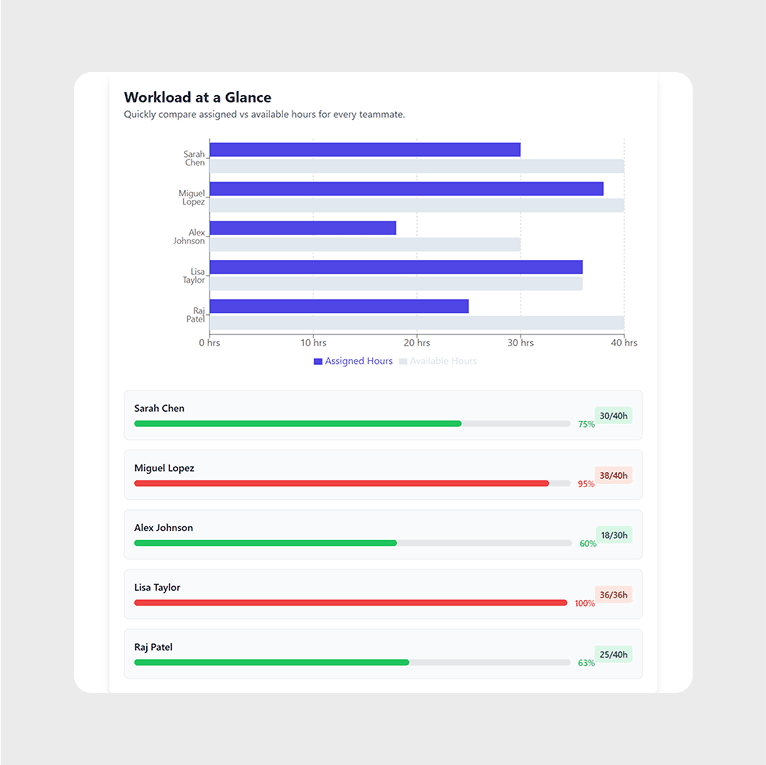
Resource & Progress Insights
Spot over-loaded teammates and forecast sprint completion with a quick glance at two smart visuals.
Planned vs Actual bars reveal each contributor’s burn-rate and remaining hours.
Progress-wise Task Count chart tracks daily movement between states to project finish dates.
Click any bar to reassign or rescope tasks in-line—no context-switching.